01 →
Prepare
Begin with the daily reference levels already established for the trading day.

PRIVATE INVITE-ONLY TRADINGVIEW INDICATOR
A fresh map of reference levels for each trading day.
Once established, the levels remain fixed as price develops.
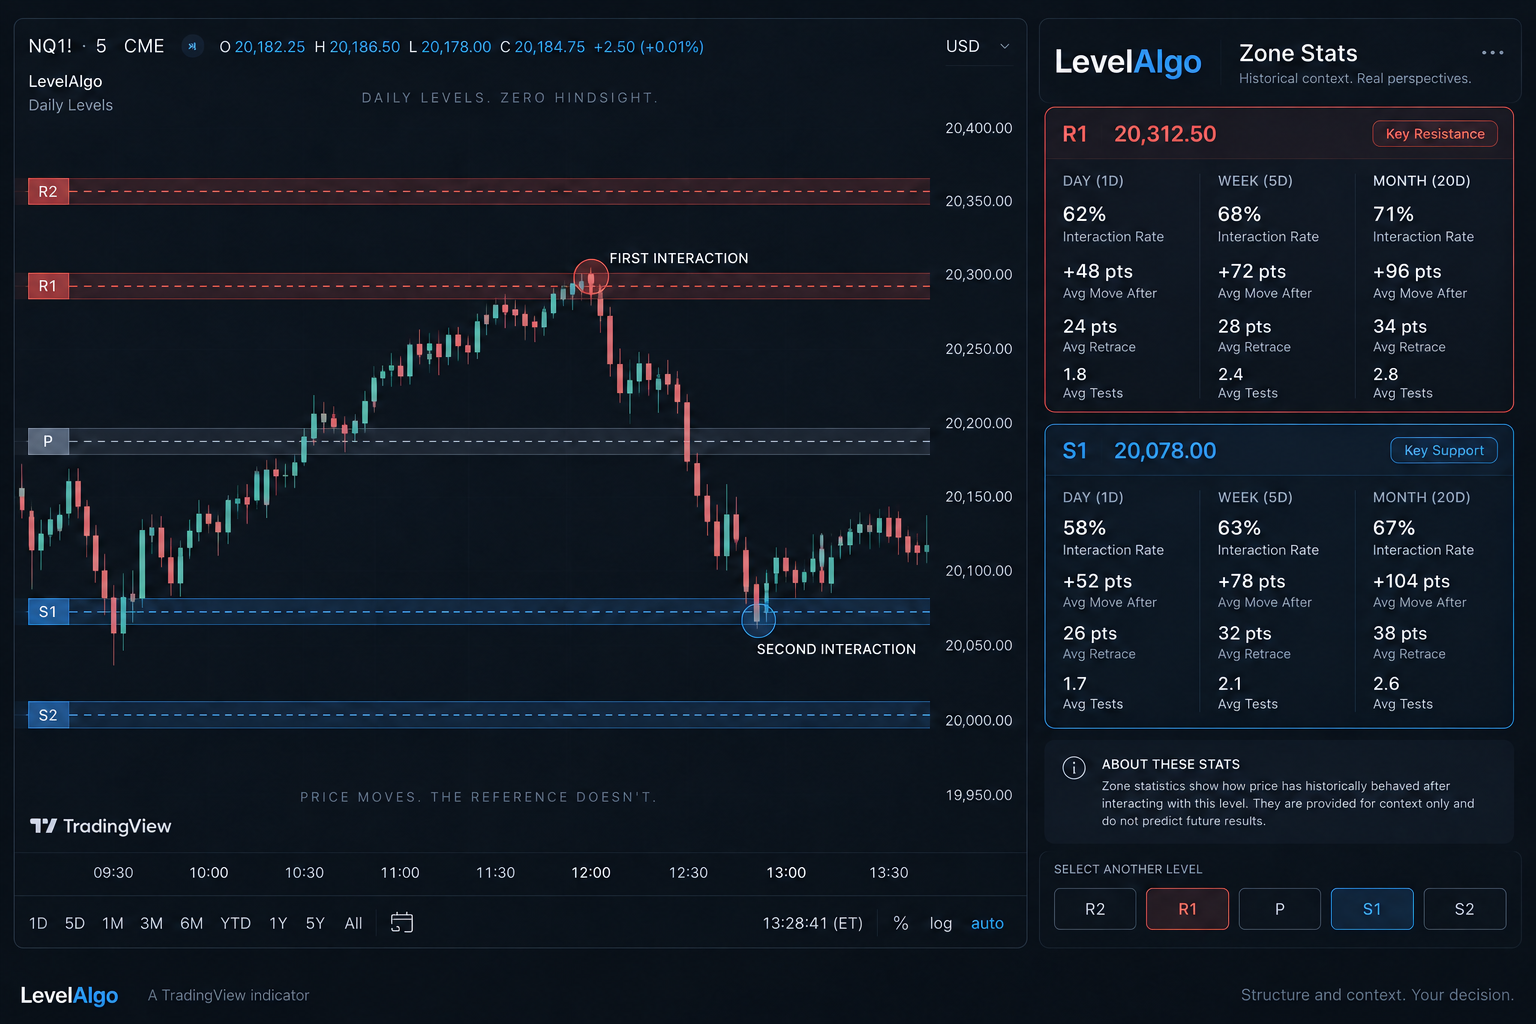
The LevelAlgo TradingView indicator includes Zone Stats: historical context alongside the daily map, with Day / Week / Month views. The concept below illustrates how that context can be presented.
Reference points first.
Observation and interpretation follow.
Begin with the daily reference levels already established for the trading day.
Watch price reach and interact with those areas.
Read the reaction alongside historical context from LevelAlgo and the developing session.
Apply your own execution and risk management.
Choose a billing period for access to the private LevelAlgo TradingView indicator.
Membership opening soon.